mrythm PowerCONCRETE
Launch PowerCONCRETE app
← mrythm
Mrythm  /  ProductAvailable now
PowerCONCRETE™

Precast plants pay for cement they don't need.

PowerCONCRETE finds the lowest-cost concrete mix that still meets every requirement you have — strength, finish, durability, workability, color, carbon — and shows you exactly which limits are holding it there.

For
Precast concrete plantsarchitectural & structural
Replaces
Conservative overdesignwith computed limits
Typical impact
≈ $275,000 / yearat 25,000 yd³
Carbon
12–19% lowerat no cost premium
Scroll
01 / 09
The hidden cement tax

$160,000 to $480,000 a year. Nobody budgeted for it.

Cement chemistry shifts between mill runs. Quarries evolve, so gradation drifts. Supplementary cementitious materials vary in reactivity and fineness.

Your lab absorbs all of it the only way it safely can — a few extra pounds of cement here, a wider margin there. It works. It also never comes back off.

For a plant running 20,000–40,000 yd³ a year, 40–60 lb/yd³ of accumulated caution is $160,000–$480,000 in recurring annual margin — spent again every year, embedded in recipes nobody has re-derived from first principles.
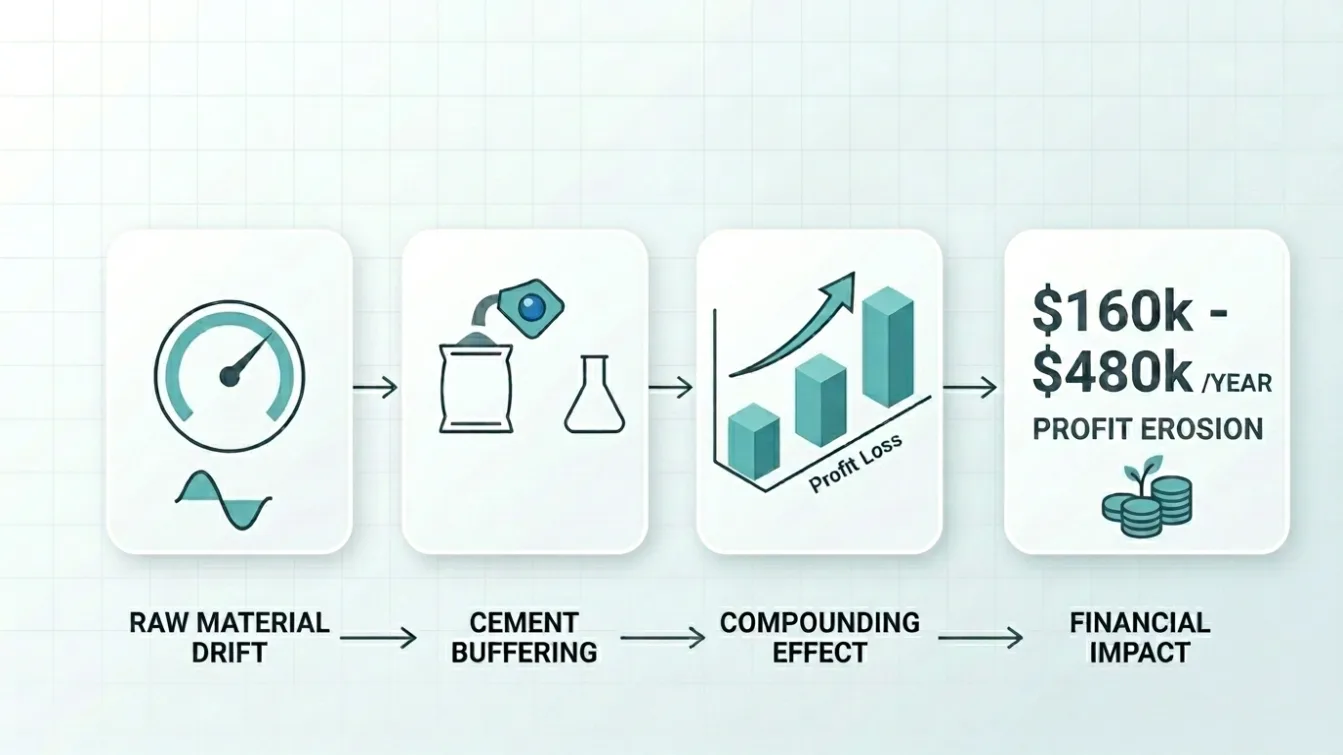
Chain diagram: raw material drift leads to cement buffering, which compounds over time into $160k–$480k per year of profit erosion.
How a rational safety habit becomes a permanent line item.
02 / 09
This is not a mistake

Every good plant does this. It's the rational move.

Stripping failure is expensive. Surface defects get rejected. Curing cycles are locked to the schedule. When uncertainty rises, adding margin is fast — and recalculating is not.

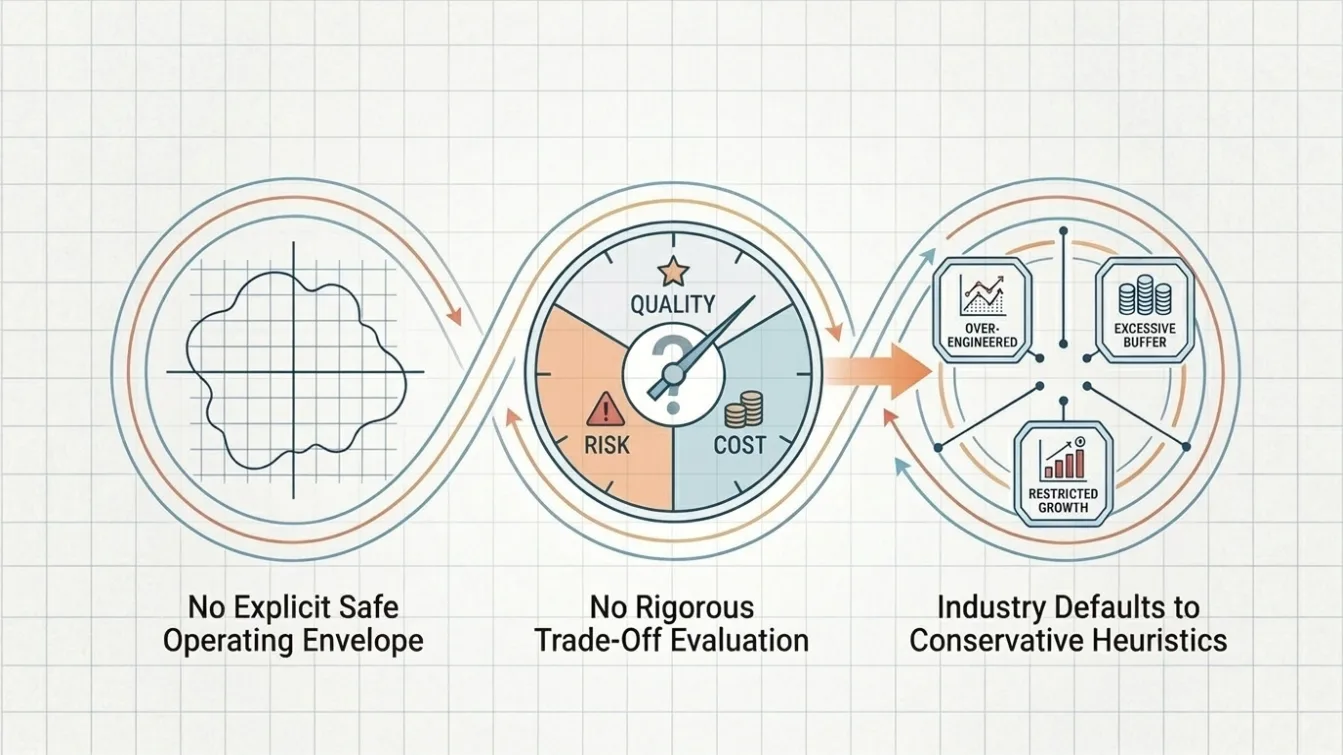
Three linked ideas: no explicit safe operating envelope, no rigorous trade-off evaluation, and so the industry defaults to conservative heuristics — over-engineered mixes, excessive buffer, restricted growth.

The problem isn't the caution.

Conservative buffering is the correct response to variability when you have no other instrument. It protects the schedule, the finish, and the customer.

The problem is that nobody has calculated where the safe edge actually is.

Without a computed boundary, there is no way to know how much margin is engineering and how much is habit. So the margin only ever grows.

03 / 09
The key insight

Your mix isn't a recipe. It's one point in a space nobody has mapped.

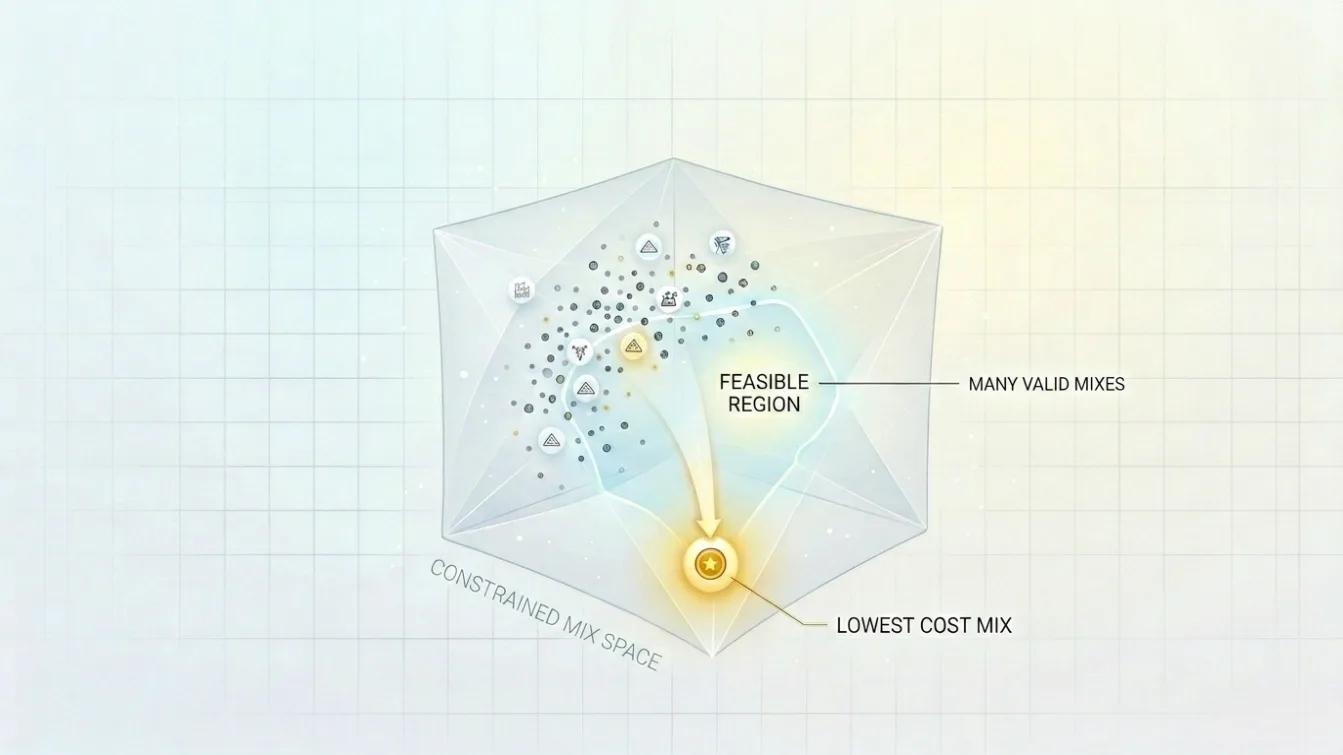
A constrained mix space drawn as a faceted volume: many valid mixes form a feasible region, and one glowing point marks the lowest-cost mix inside it.
A

Thousands of mixes satisfy every requirement you have.

Not one. For any product you make, a whole set of formulations clears strength, finish, durability and workability.

B

That set is real, bounded, and computable.

Its edges are physics and chemistry — packing, paste balance, w/cm, binder limits — not opinion.

C

Your current mix sits somewhere inside it.

Almost certainly not at the cheap end, because nothing in the normal workflow ever pushes it there.

04 / 09
What PowerCONCRETE does

Three moves.

Nothing is inferred from history. Everything is computed from your materials, your specifications and your plant's own rules.

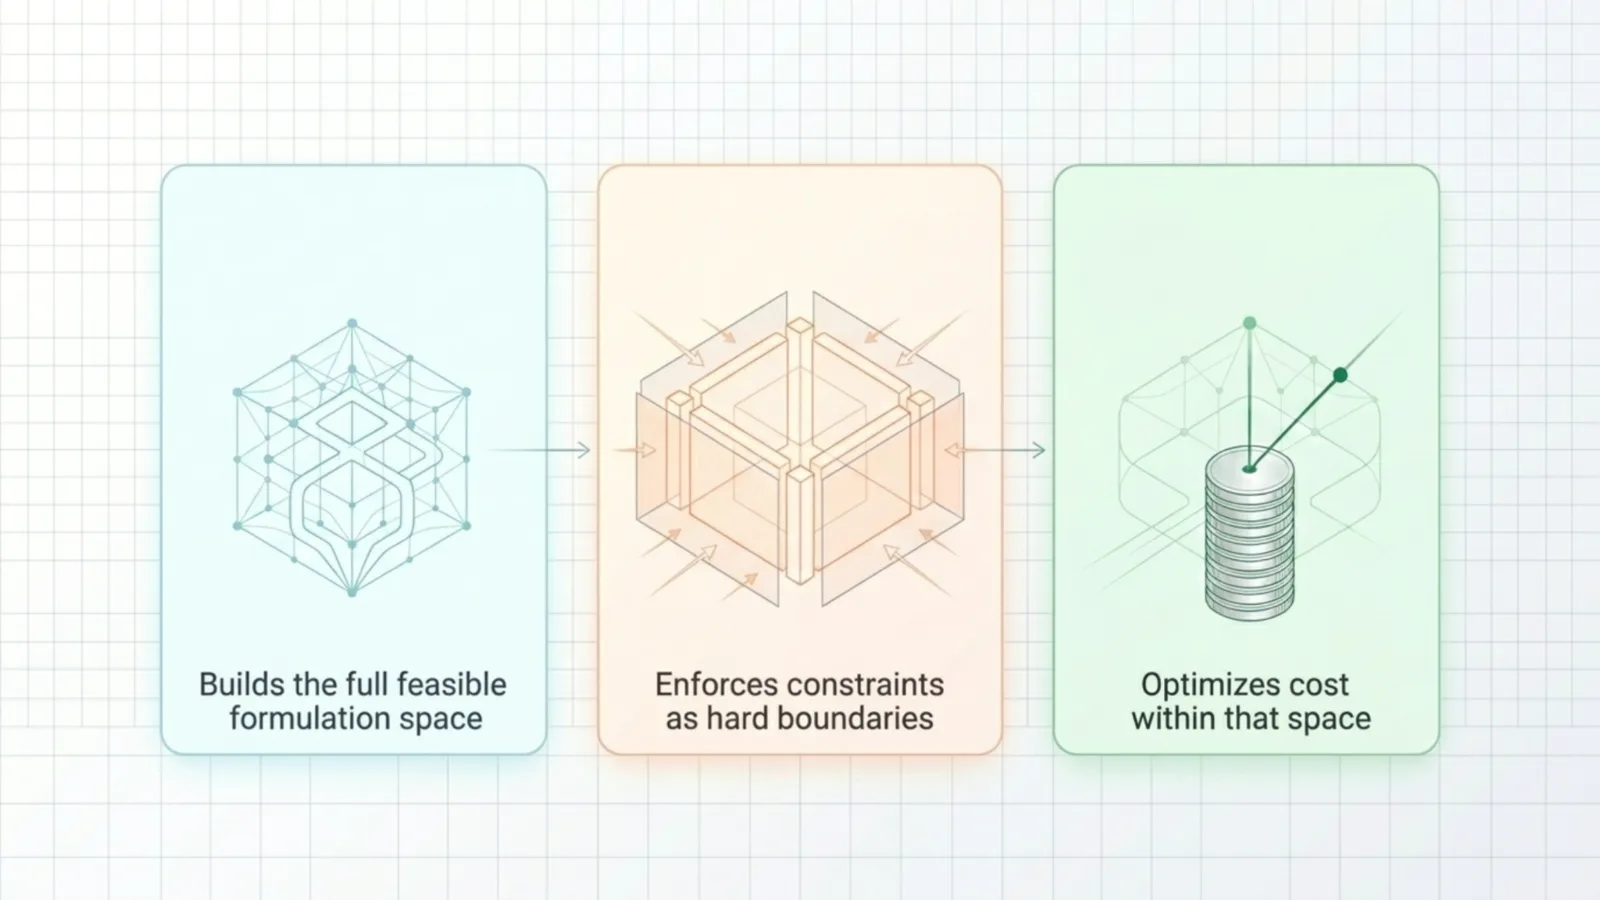
Three panels: builds the full feasible formulation space, enforces constraints as hard boundaries, optimizes cost within that space.
01

Builds the full feasible space

Every mix your actual materials can produce — densities, particle size distributions, chemistries, costs and carbon factors from your own library.

02

Enforces your constraints as hard walls

Not preferences to be traded away. Walls. The solver cannot return a mix that breaks one of them.

strengthw/cmSCM limits particle packingrheologypaste balance aircolordurabilitycarbon cap
03

Finds the lowest-cost point inside

And names the limits that are holding it there — so your engineers can see what a change would actually be worth before making it.

When something changes — new cement chemistry, a different quarry, a price move — the feasible space is recomputed and a new optimum is returned. Variability stops being financed with cement.

05 / 09
Where it fits

One box in your plant. Nothing else moves.

Your manufacturing method, curing process, equipment, labor practices and QC procedures are treated as fixed inputs — not variables to be optimized.

Where PowerCONCRETE sits in the precast manufacturing process Eleven sequential plant operations — engineering and shop drawings, mold preparation, reinforcement and embeds, batching and mixing, casting and consolidation, curing, stripping or demolding, finishing, quality control, storage, shipping — enclosed in a dashed boundary marked "plant process, treated as fixed". PowerCONCRETE sits outside that boundary and feeds concrete mix optimization into the batching and mixing step. PLANT PROCESS — TREATED AS FIXED Engineering& ShopDrawings MoldPreparation Reinforcement& Embeds Batching& Mixing Casting &Consolidation Curing Stripping(Demolding) Finishing QualityControl Storage Shipping PowerCONCRETE Concrete MixOptimization
← scroll to see the full process →
PowerCONCRETE improves the engineering decision that happens before production begins. Everything inside the dashed boundary stays exactly as it is.
IN THE LAB

Used during mix design

Your lab updates material data and computes a new optimized formulation. Existing spreadsheets and habits stay available alongside it.

IN THE PLANT

Validated your normal way

The resulting mix goes through your standard trial, approval and release procedure before it ever reaches production.

NO DISRUPTION

No new equipment. No retraining.

Batching systems, quality control and production operations are untouched. Nothing about how you build changes.

06 / 09
What you get

An answer — and the reason for it.

Real screens from the product. Click any of them to read the numbers.

PowerCONCRETE optimized mix screen showing optimal cost per cubic yard, total mass, w/cm ratio, air content, embodied carbon, the full material batch, a packing quality gauge, Tarantula curve, packing deviation by sieve and ASTM gradation chart. Click to enlarge
The optimized mix. Cost per cubic yard, the full batch by material, w/cm, air, embodied carbon against your cap — and packing verified against ASTM gradation and the Tarantula curve.
Scenario comparison screen: base architectural mix at $166.44 per cubic yard versus a carbon-focus scenario at $157.19, with a performance delta summary and material composition comparison. Click to enlarge
Scenario comparison. Base against cost-focus, carbon-focus, strength-focus — with the exact cost, cement, w/cm and CO₂ deltas between any two.
Cost waterfall by material class alongside an embodied carbon EPD report and a constraint slack table showing which constraints are binding, near-binding and slack. Click to enlarge
The reasoning, exposed. A cost waterfall showing where every dollar came from, an EPD-ready carbon report, and a constraint table naming exactly which limits are binding.
07 / 09
Cost and carbon

Cheaper and lower-carbon turn out to be the same direction.

General contractors and owners are making embodied carbon a condition of the job. The useful surprise is that you don't have to buy it.

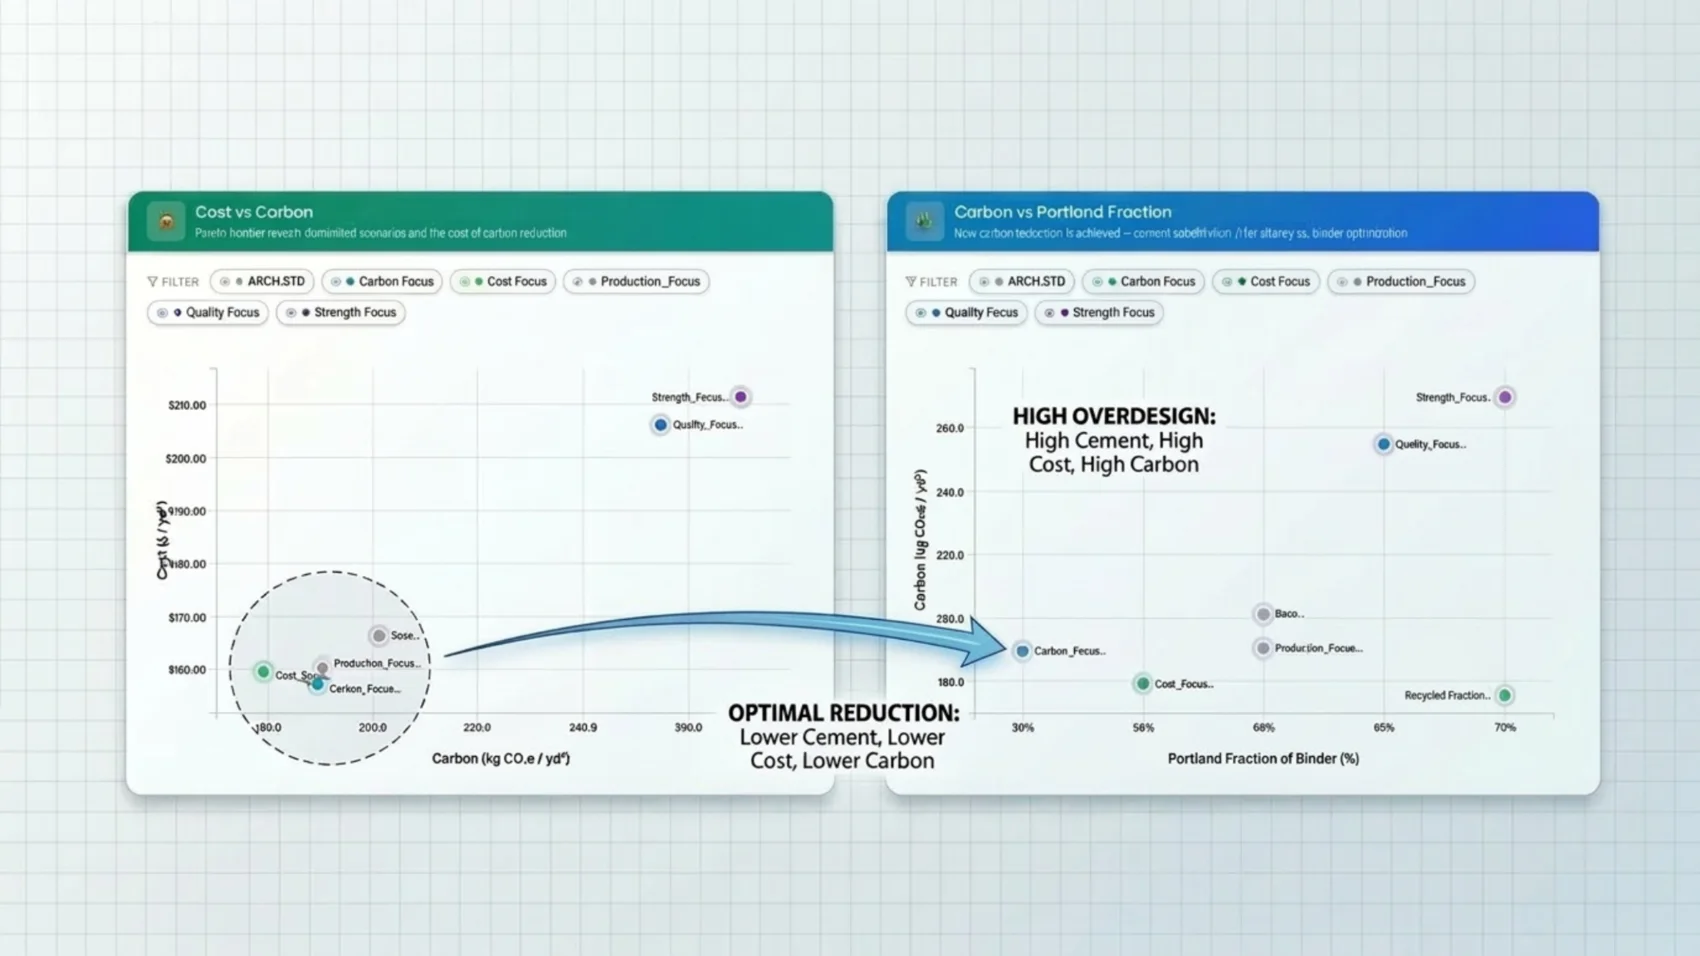
Click to enlargeTwo scatter charts: cost versus carbon, and carbon versus Portland fraction of binder, showing high-overdesign scenarios in the high-cost high-carbon corner and the optimal reduction cluster at lower cement, lower cost and lower carbon.
High overdesign sits at high cement, high cost and high carbon. Optimization moves all three down together.
12–19% lower embodied carbon

Carbon-focus scenarios cut embodied carbon 12–19% against base mixes while holding or reducing material cost.

In mix families already engineered for low carbon intensity, the carbon-focus scenario reaches below 120 kg CO₂e/yd³ at essentially no premium over the base mix. And when a GC asks for an EPD, you already have the report.

Representative model results. Plant-specific values depend on local materials, cement factors, SCM availability and performance constraints.

08 / 09
What it's worth

Mix design sits upstream of every batch you pour.

Which is why a small change to the formulation multiplies across an entire production year. A representative mid-tier operation:

Annual production
25,000 yd³
Baseline cement
750 lb/yd³
Cement price
$0.20 /lb
Optimized reduction
−55 lb/yd³
Saving per yd³
$11.00
Recurring annual saving
$0

No operational disruption. No new equipment. No staffing changes. The saving is structural — it comes from replacing conservative buffering with engineered constraint control, on a decision you already make every time a mix is designed.

09 / 09
Why deterministic

A prediction is not a guarantee. On a stripping day, that difference is the whole job.

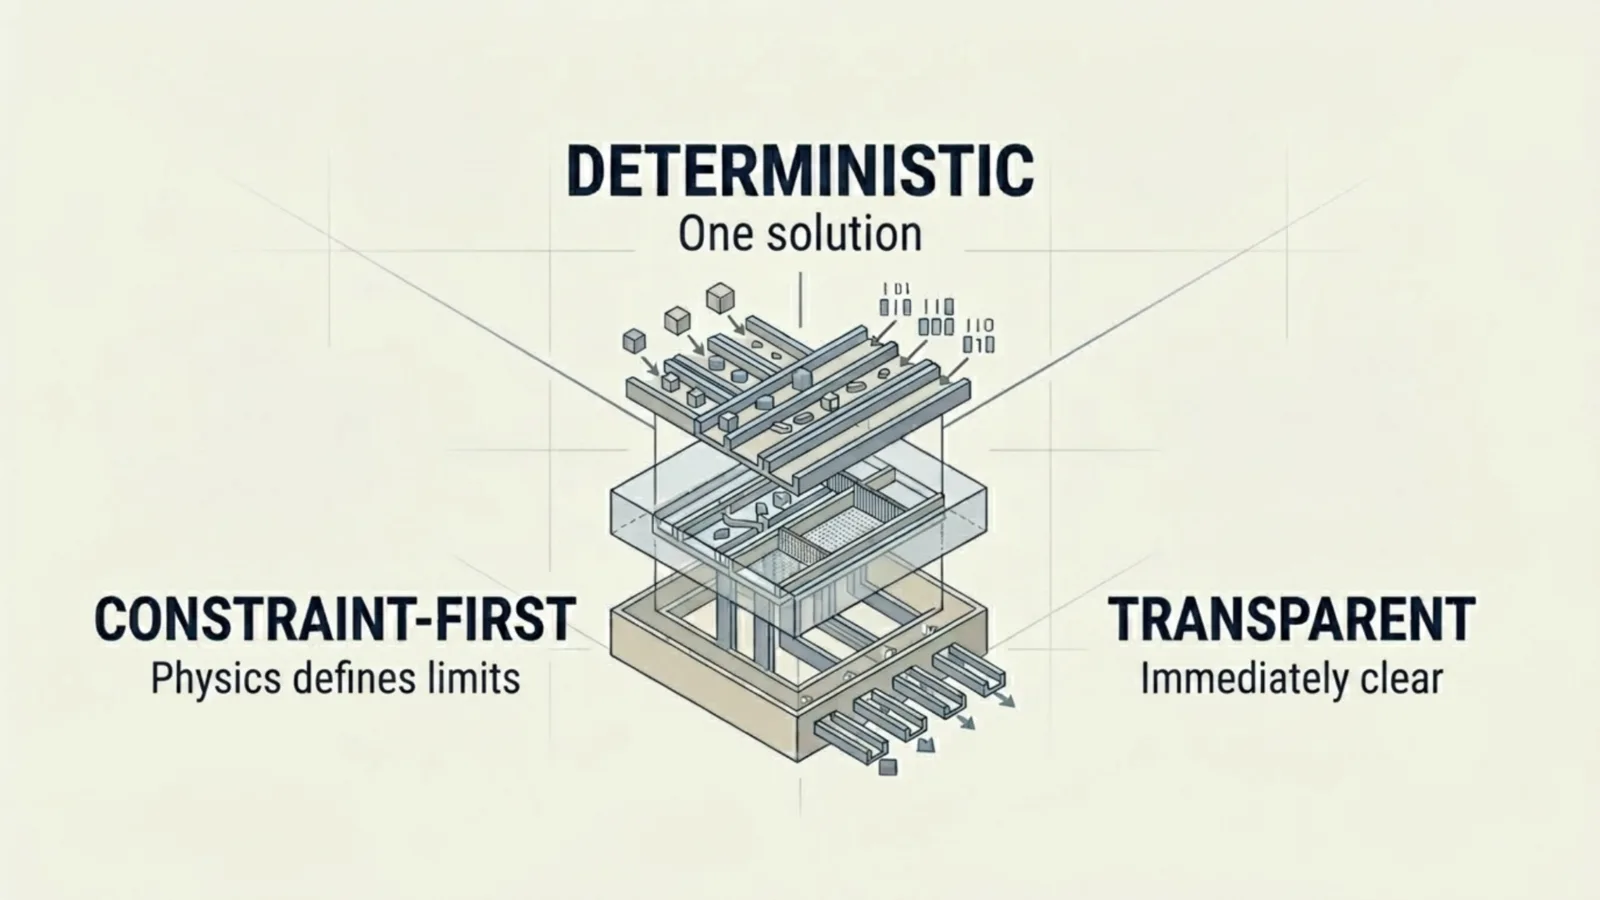
Exploded isometric diagram labelled deterministic — one solution, constraint-first — physics defines limits, and transparent — immediately clear.

vs Spreadsheets

A spreadsheet evaluates one candidate mix against nominal assumptions. It cannot define a feasible envelope, enforce constraints across chemistry, packing and rheology at once, or solve for an economic optimum. It executes engineering judgment — it doesn't expand it.

vs Batch automation

Dispatching, moisture compensation, inventory, scheduling. Genuinely valuable, and complementary — but all of it operates downstream of the mix decision, never on it.

vs Machine learning

Pattern-based prediction in exchange for constraint enforcement and interpretability. When stripping is on the line, knowing why a formulation is safe matters as much as knowing that it probably is.

The payoff Three things you can't buy any other way

Transparency — engineers see which constraints govern the solution, and why. Reliability — the solver cannot propose a mix that violates a defined limit; safety is enforced, not weighted. Interpretability — binding constraints and sensitivities are directly observable, so a decision can be explained and defended.

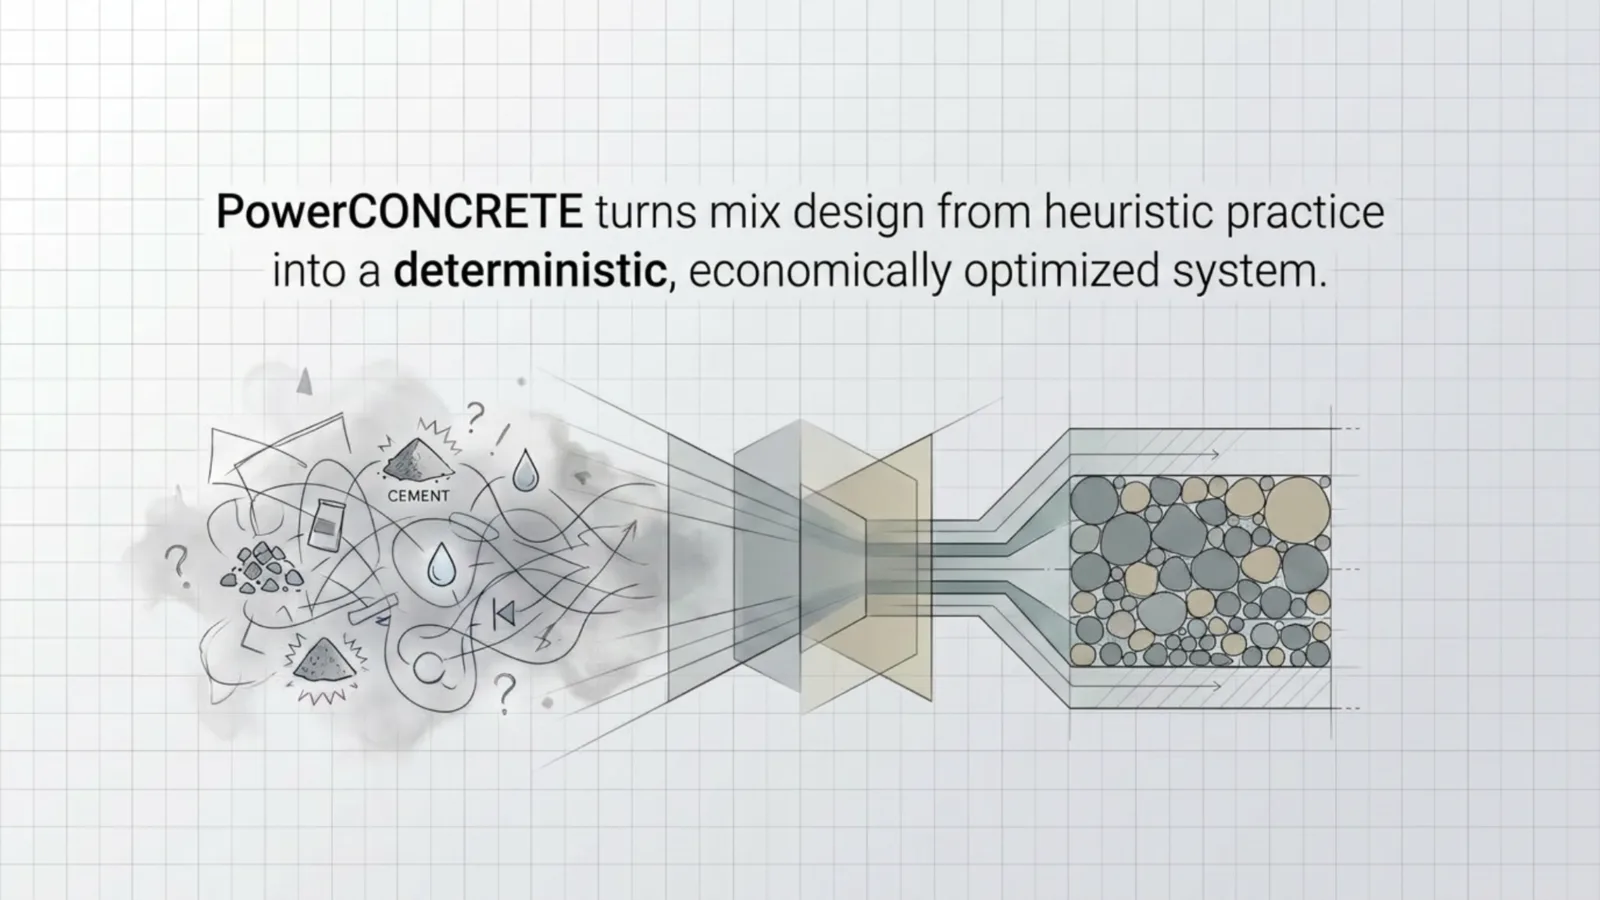
PowerCONCRETE turns mix design from heuristic practice into a deterministic, economically optimized system — illustrated as scattered, uncertain inputs resolving through a lens into an ordered, well-packed aggregate structure.